eNews
#03 2023
The epic journey of data
By Abri de Buys, Chief Instrument Technician: EFTEON (on behalf of SAEON’s Fynbos Node)
SAEON recently signed off on a contract marking the end of the two-year “Historic Hydromet Data Project”. This project has contributed essential verifications, corrections, metadata and recommendations for SAEON’s historic catchment data sets, comprising ~41 million records which are available to the public for free.
A bit more than a decade ago, SAEON inherited a large collection of data from the Council for Scientific and Industrial Research (CSIR), originating from ~70 years of investment made by the South African Forestry Research Institute, and later the CSIR, in afforestation and catchment management experiments distributed across the country. SAEON undertook to continue with the curation of these data and to make it publicly accessible as the historical foundation for our continued catchment monitoring (particularly at Cathedral Peak and Jonkershoek). SAEON’s rationale is that data users should be able access a (more or less) continuous record of stream flow, rainfall and other meteorological data spanning from the 1930s to the present day and apply these data to questions related to long-term environmental change – at no additional cost.
This is of course easier said than done. In the last decade, SAEON has built a bespoke database to accommodate historic and new data. We have also developed the functionality to get users direct access to the data via a data portal. However, even within the relative stability of one institution, using largely the same technology, managing data with a mix of contractors and dedicated staff members has been tricky.
What to do then, with an inherited data set that was generated with instruments we would now expect to find in museums, passed through data management technologies that are obsolete or no longer exist and that went through several institutional changes?
Modern data users and paper charts
In the 98 years since the first rainfall record in this collection (Herehuis, Jonkershoek, Figure 1), a lot has changed. One of the most significant changes is how data users expect to interact with data sets.
Our job as current curators of these historical data is to understand where each data set fits in the continuum from paper chart to queryable database, prioritise data sets for further processing towards the latter and ensure we gather as much information as possible about the data sets to aid users (Figures 2 & 3). Simply moving data from one institution to another does not constitute a successful transfer. Different institutions have their own internal resources, priorities and limitations that result in particular ways of organising and describing data and the people who understand how these systems work are essential for making sense of it and facilitating transfer. The historic hydromet data project was therefore essentially aimed at transferring some institutional memory to accompany the historic data sets.
A pivotal moment in the history of this collection was the development in the 1990s of a digitising programme and accompanying data base that could ingest data from digitisers and early electronic data loggers. A vault full of paper chart data with peculiar needs were thus accommodated and partly transformed to digital data.
At the time SAEON came along, this database with ~70 years of data survived on a single outdated computer carefully guarded by technicians at the CSIR who used to be involved in the data collection and management. A SAEON data manager at the time set about transferring priority data sets, and in the early 2010s SAEON appointed a contractor to start the development of a “Streamflow and Weather database” to accommodate the historic data. Priority uploads were done, followed shortly by the departure of the data manager.
With pressure mounting on SAEON to publish data, the database development contractor was appointed to upload outstanding data sets. This had its challenges given the fact that no-one at SAEON was particularly familiar with the data sets and least of all the contractor. The upload target was reached, however, but questions remained about the organising and metadata.
The importance of hardcopy data and institutional memory
The uploaded data required verification, checking, metadata creation and organising to control the quality of the work done by the contractor, improve the quality where possible and document essential points and resources that can assist users with understanding the data sets’ potential uses and limitations. This required someone intimately familiar with the collection of paper charts, the Autographic Chart Digitizing System and database used to digitise paper chart data, knowledge of the instruments used between 1935 and 2008 as well as knowledge of the digitising protocols and problems associated with data collection and processing (Figure 4).
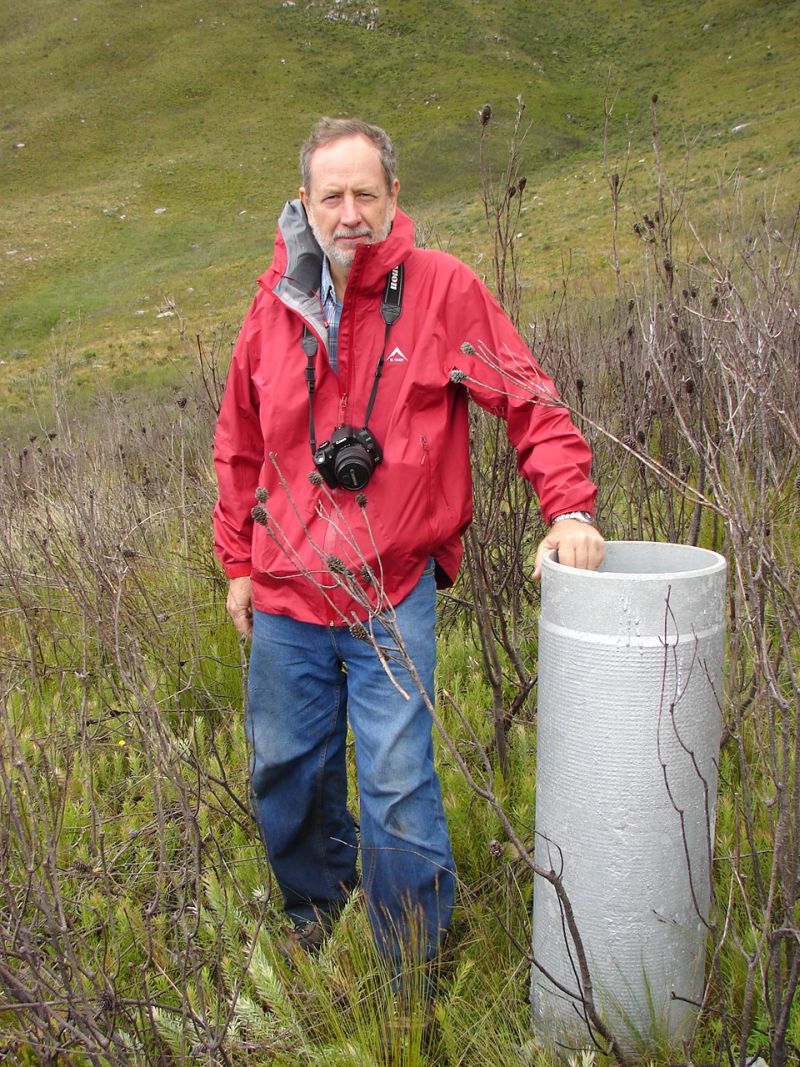
SAEON was extremely fortunate to be able to appoint retired CSIR technician, Eric Prinsloo (Figure 5), as consultant for this project. His highly specialised knowledge allowed us to conduct detailed verification checks, compile metadata notes, extract outstanding data from the historical database (on the aforementioned old computer), organise supporting documents and produce reports with recommendations for the next steps of data curation.
The Historic Hydromet Data Project repeatedly proved the value of being able to go to the hardcopy source to clarify questions and the power of having someone with experience conducting investigations. It also emphasised the need for SAEON to secure the hardcopy data sets in perpetuity and demonstrated that a multi-decade data set is more than numbers in a database, even if carefully described. The importance of transferring as much nuance and institutional memory as possible to bring long-term data collections to life cannot be overstated and people are the essential ingredient.
The vault full of hard copy data on paper charts and field notebooks dating back to the 1930s was ironically in a much better state than the old computer, which, as if scripted, gave up the ghost during a bad bout of loadshedding (rolling blackouts) during the course of the project. Thankfully by then all essential outstanding data had been extracted, transferred to SAEON and backed up.
Margaret Koopman, SAEON’s former data librarian, and intern Sibongiseni Nyendwana did a thorough investigation and compiled an inventory of the vault in 2016–17. Its future is uncertain, and it remains to be seen how SAEON will secure this resource.
The next step for SAEON is to implement the corrections and recommendations from this project, which will result in a value-added resource for the global environmental research community and the public.
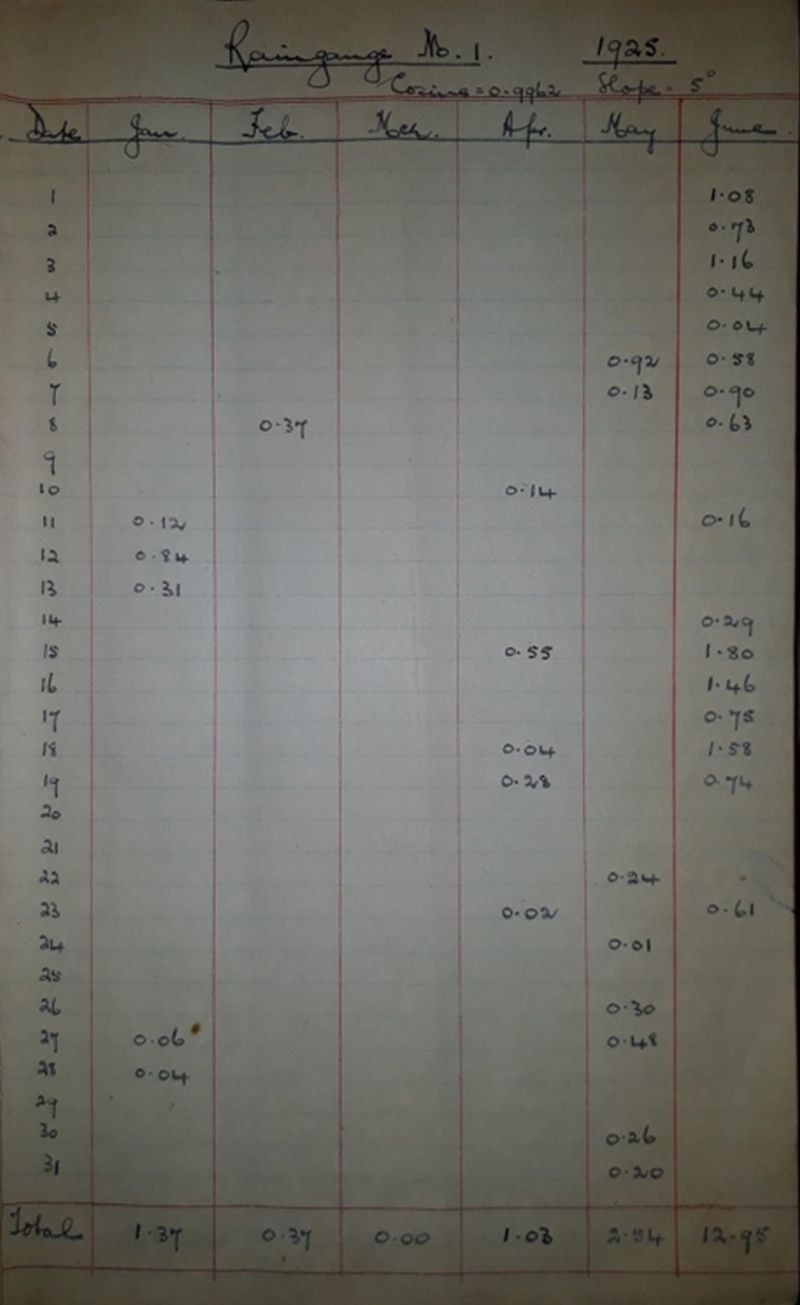
Figure 1. The Herehuis (Manor House, Jonkershoek, Western Cape) field book for January to June 1925, indicating the first rainfall figure on 11 January. Note the angle of the rain gauge orifice and associated correction factor. Some rain gauges were installed perpendicular to the slope. (Photo: Eric Prinsloo)
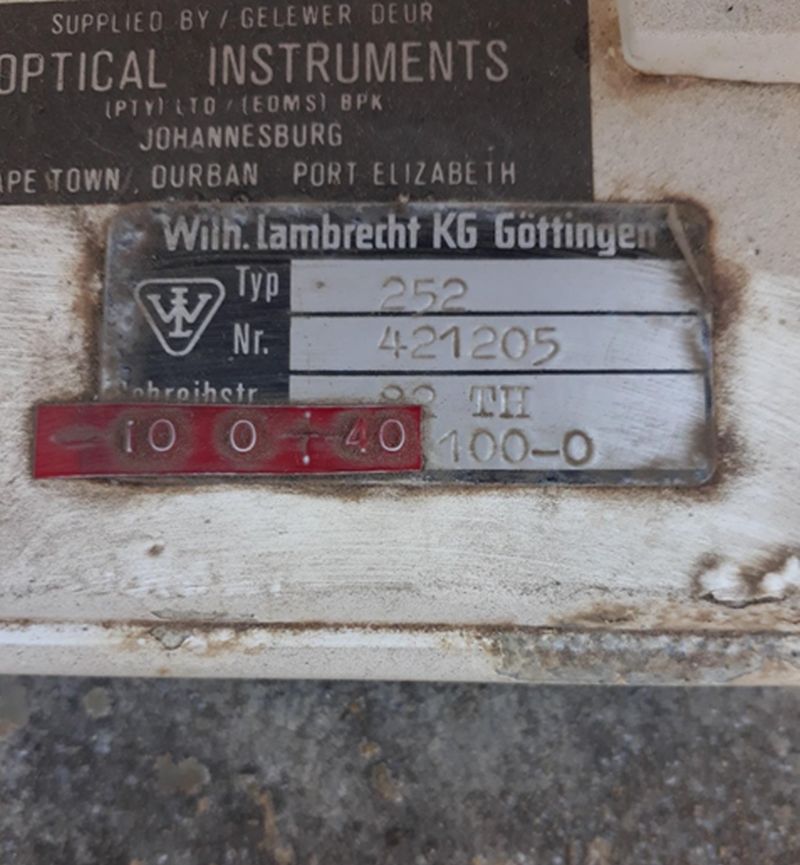
Figure 2. When instruments from overseas manufacturers are recalibrated for local conditions, data digitisers, data curators and data users need to be on their toes to ensure this essential information is passed on and understood. (Photo: Eric Prinsloo)
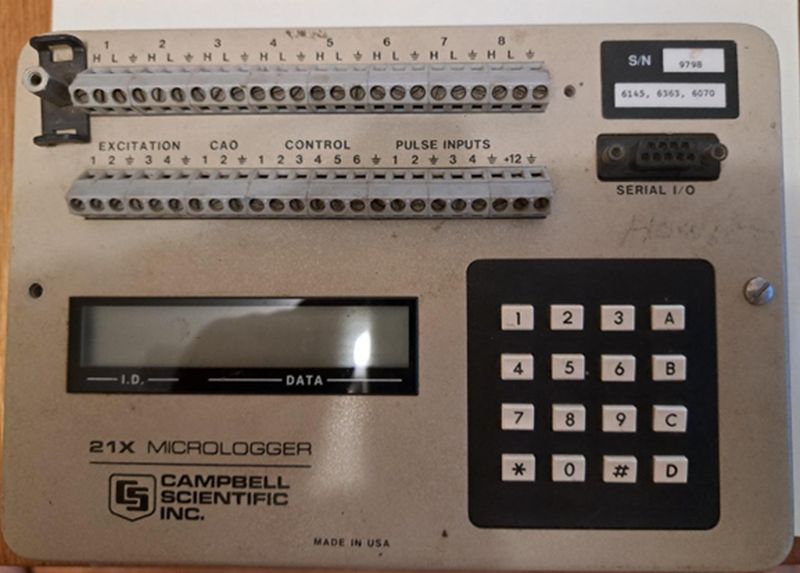
Figure 3. Somewhere in the continuum from hand-written field notebooks to queryable web APIs fit the very first data loggers used in the catchment experiments. These were Campbell Scientific 21X Microloggers, using Walkman cassette tape recorders for recording data. (Photo: Eric Prinsloo)
Figure 4. When resources are limited and conditions allow (dry season), Casella rain gauge charts can be re-used to collect several weeks of rainfall data on a single weekly chart. This creates challenges at the digitising step and careful notes to keep track. (Photo: Eric Prinsloo)
Figure 5. Consultant Eric Prinsloo on a field trip with SAEON Fynbos Node staff to Jakkalsrivier, site of one of the historic catchment experiments. (Photo: Nicky Allsopp)
