eNews
#01 2022
New study investigates fog water use by plants
By Abri de Buys and Dr Rob Skelton, SAEON Fynbos Node
SAEON’s Fynbos Node has been monitoring fog at selected sites in Jonkershoek and Table Mountain National Park since 2013. In March this year we will have nine years of almost continuous fog data for one of our sites, Dwarsberg.
Our fog monitoring allows us to capture a more complete picture of a site’s moisture regime than traditional rainfall measurements alone, thereby allowing a closer approximation of the conditions that vegetation experience. Importantly, we have been able to describe the moisture regimes at our sites thoroughly, including fog behaviour through the severe 2014–2018 rainfall drought. This provides a solid baseline for monitoring change in future.
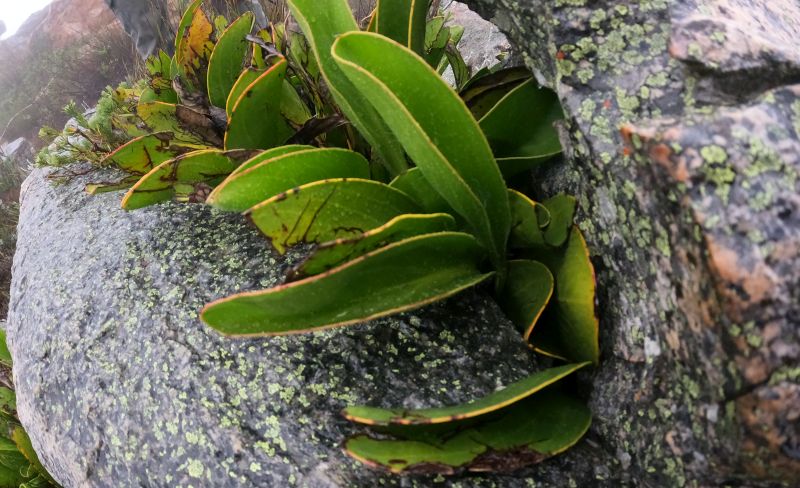
Plant use of fog water in Fynbos has been speculated on since the region’s first fog studies in the early 1900s. (Photo: Abri de Buys)
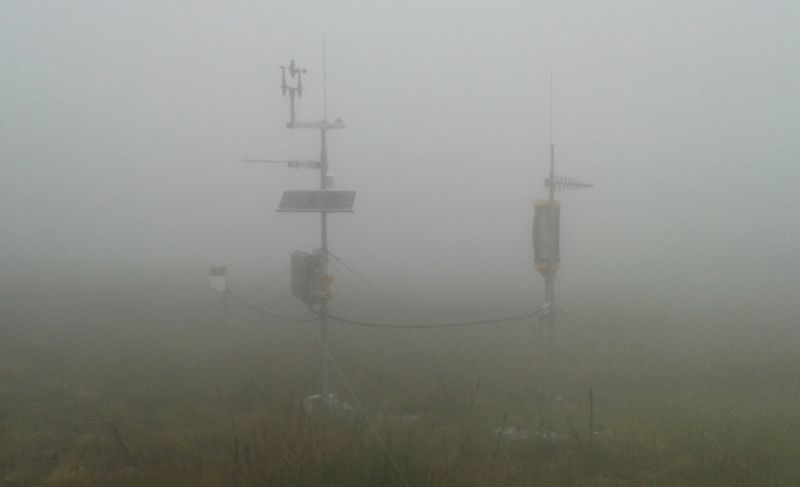
Fog at Jonkershoek’s high-elevation (Dwarsberg) weather station. (Photo: Abri de Buys)
How it works
Weather data are collected at hourly time steps, which allows us to examine the conditions and how they vary in high temporal resolution. Our fog collectors are built from a special louvered mesh which is also in use by fog researchers in other parts of the world.
The cylindrical shape of the collectors allows fog interception from all directions. The moisture intercepted by the collector drains into a tipping bucket rain gauge and the readings are corrected for the mesh area exposed to fog.
This gives us some measure of how much water blows across the landscape during fog events and how they compare to rain. This allows us to determine the frequency and duration of fog events and inter-event dry periods. We can, for example, compare the duration of dry events in the rainfall record with the duration of dry events when rainfall and fog are considered together.
We have compared these across season. We have analysed fog events to determine what weather conditions (wind direction and air temperature) are associated with them. We have quantified fog associated with orographic clouds driven by the southeaster that dominates dry season months versus fog from stratus cloud layers associated with frontal systems and north westerly winds in the wet season.
We have confirmed that vegetation experiences fog events as moisture inputs by using leaf wetness sensors which show that leaves are wet when the fog collector is collecting moisture. We have also observed fog water collecting on plant surfaces and dripping to the soil or flowing down stems in the absence of rainfall.
From a hydrological perspective, both rainfall and fog measurements have certain limitations and assumptions. It is tempting to assume that rainfall measured with a rain gauge all reaches the soil (some of it remains suspended in plant canopies and evaporates directly back into the atmosphere).
Fog quantification has similar nuances, for example the temptation to assume that plants, rocks and other surfaces intercept fog droplets with the same efficiency as fog collector mesh. Interception by vegetation is in fact much more complex and related to the structure of plants which can vary greatly.
Describing moisture regimes carefully allows us fascinating insight into the conditions experienced by plants at the different sites. It allows us to speculate about potential impacts if the drivers of fog regimes should change in future. What we had not done, until recently, is measure how plants actually respond to these conditions.
What do plants do with fog water?
Like us, plants breathe – they exchange gas with the atmosphere when they photosynthesize during daytime. They do this by opening tiny pores called stomata on the surfaces of leaves. The aim is to absorb CO2; but absorbing CO2 through open stomata comes at the cost of losing water through evaporation out of those same pores (transpiration).
The rate at which this water loss occurs is related to how dry the surrounding air is. Very dry air means a steep moisture gradient between the leaf tissue and air outside of the plant, and therefore the potential for faster water loss. Moist air means a low gradient and less risk of water loss.
Reduction of water loss is half the story. Fog can also add to the available water supply through a variety of mechanisms.
Plant use of fog water in Fynbos has been speculated on since the first fog research by Rudolph Marloth in the early 1900s. While plant use of fog water has been demonstrated in tropical montane cloud forests and Californian redwood forests, among others, it has not been studied specifically in Fynbos. Demonstrating plant behaviour during dry conditions and plant response to fog events is the next step in our fog research.
There are a few different techniques to measure water loss from plants. Some techniques can be used at the individual plant level while others are used at an ecosystem level (e.g. flux towers provide an integrated estimate of gas exchange by an entire plant community). One plant-level technique measures the rate and direction of sap flow in the plant’s vessels.
Previous studies in Fynbos have shown that we can successfully record the expected response of plants to dry and moist air using custom-built miniature sap flow gauges attached to plant stems. Variations of the technique are also used in many other parts of the world in applications from agriculture to ecology.
SAEON’s Fynbos Node has begun to use sap flow sensors and weather station data to investigate whether Fynbos plants are relying on fog moisture. We have chosen a high elevation site in the relatively dry Swartberg range near Seweweekspoort.
A new weather station (http://lognet.saeon.ac.za:8088/Besemfontein/index.html) with fog collector was installed in August 2021 to begin collecting data to describe the site’s moisture regime and general weather conditions experienced by the plants. The site is home to an endangered Protea species that occurs above 1 800 metres above sea level and has previously been suggested to make use of fog water.
In December 2021, several individuals of the Protea were fitted with miniature sap flow gauges connected to data loggers. The loggers were set up with remote data transmission systems, so data are sent to a SAEON server automatically, allowing us to keep an eye on the gauges remotely and start analysing the data.
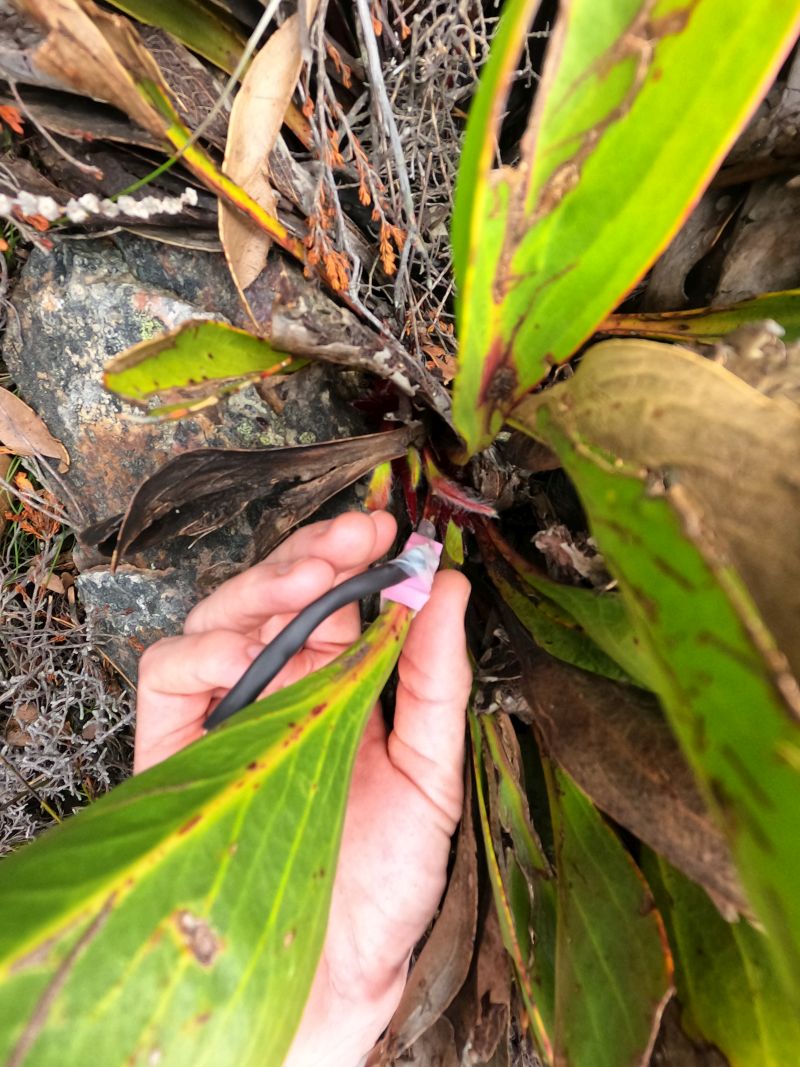
A miniature sap flow gauge installed on a Protea petiole. After the sap flow gauge is attached as above, it is insulated to prevent temperature fluctuations and ingress of water, which may affect the electronics. (Photo: Dr Rob Skelton)
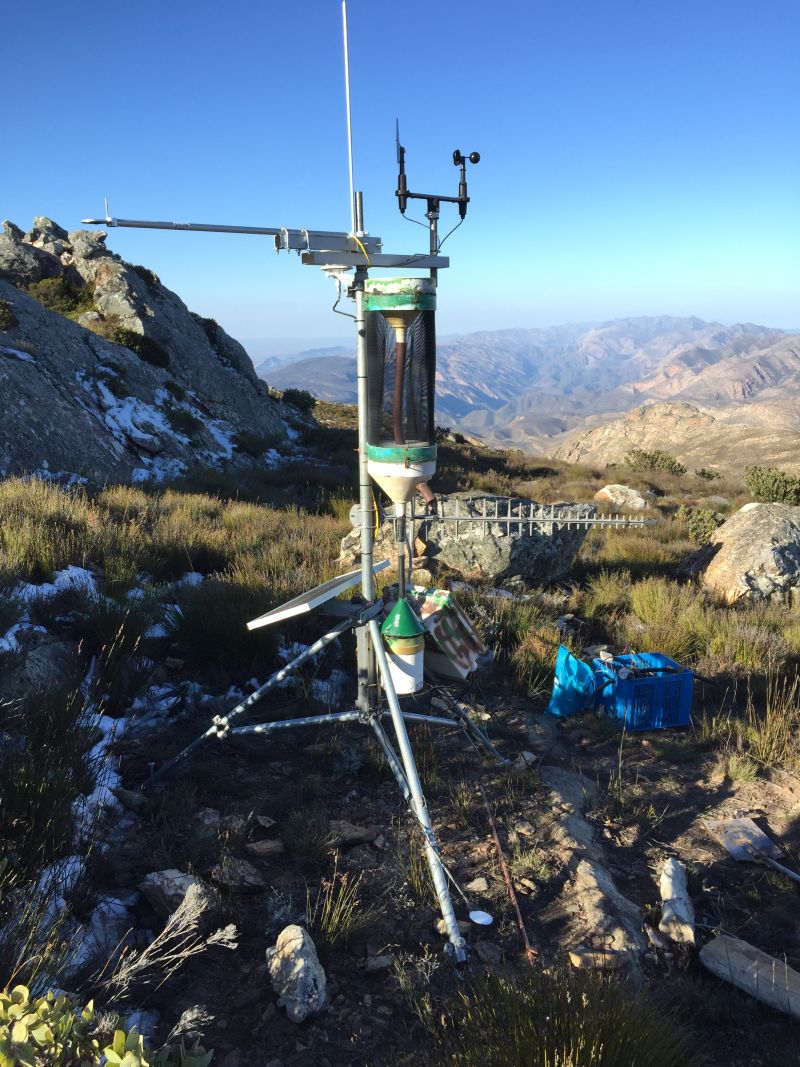
SAEON’s new weather station in the Swartberg. See “live” weather data here http://lognet.saeon.ac.za:8088/Besemfontein/index.html (Photo: Abri de Buys)
Preliminary data suggest that the site experiences fog events quite frequently during the dry season. As with some of our other sites, we expect that this is mostly a phenomenon that occurs above a certain elevation threshold.
SAEON’s Jonkershoek fog stations, for example, have shown that lower elevation sites, which are not fog prone, experience much drier and more seasonal moisture regimes. Our first month of sap flow data suggests the plants may be making use of fog water in interesting, unexpected ways, never before documented in Fynbos.
The team visited the site in February to test and confirm, under controlled conditions, whether the plants are actually doing what the sap flow gauges suggest they are. Once we are certain, we will reveal the results in a follow-up article, perhaps after publication in a peer-reviewed journal.
Stay tuned!


